
Working Capital & Cash Gap Calculator: How Much Cash Your Business Needs (South Africa)
Free working capital calculator for South African SMEs. Turns debtor, stock and supplier days into a rand cash gap, plus the growth trap and financing cost.
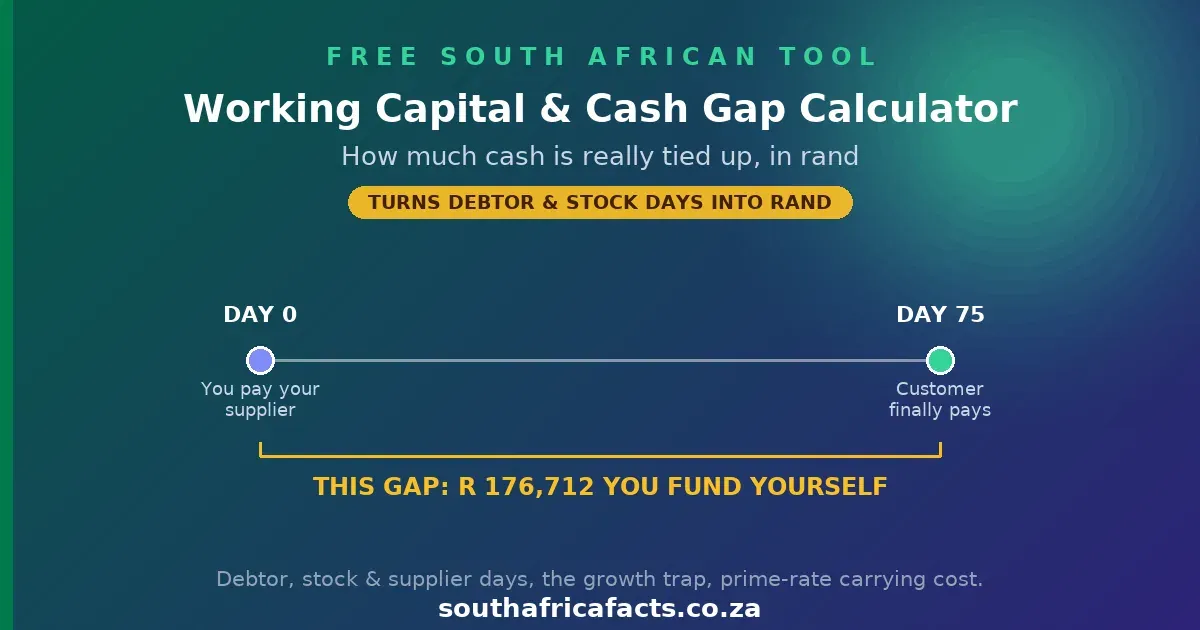
Working capital / cash gap
Working Capital & Cash Gap Calculator
Work out exactly how much cash your business needs tied up in stock and unpaid invoices before it comes back to you, in rand, not just days, and what a single day of faster payment or stock turn is worth.
Everything the business bills or receives, before expenses come off.
Sales less the direct cost of what you sold (stock bought in, materials, direct labour), as a percentage of sales. If you don't know it exactly, (turnover − cost of goods sold) ÷ turnover. This sets how much of a rand of sales is actual cash cost versus profit.
The average number of days customers actually take to pay you, not your stated invoice terms. Selling mainly to large corporates or government? Real-world payment often runs 60 to 90+ days even on 30-day terms.
The average number of days stock sits before it's sold. A pure service business with no inventory should set this to 0, the whole gap then comes from debtor days alone.
The average number of days you actually take to pay your own suppliers. Every day longer here is free financing from them, up to the point it damages the relationship or your terms.
More sales at the same debtor, stock and supplier days still means more cash locked up, before any of the extra profit reaches your bank account. This is how profitable businesses run out of cash.
South Africa's prime lending rate is currently 10.50%. A bank overdraft is commonly priced at a margin over prime depending on your risk profile, this slider just illustrates the annual carrying cost at a rate you choose. Invoice discounting, factoring and other working capital products are priced per facility, not off a posted rate, so treat this as a benchmark, not a quote.
💬 Questions about your own cash gap? Discuss this tool on the forum →
More Business tools: Employee Cost Calculator · Provisional Tax Calculator · Business Structure & Tax Calculator · Business Compliance Calendar · Employee or Independent Contractor?
What is a working capital or cash gap, in rand?
Cash flow problems, not a lack of profit, are consistently cited as the leading reason small businesses in South Africa fail. A profitable business can still be short of cash, because profit on paper and cash in the bank are two different things. Between the day you buy or make stock, the day you sell it, and the day a customer actually pays you, real rand are tied up and unavailable, while you may already owe your own suppliers for what you bought. This free working capital and cash gap calculator turns your debtor, stock and supplier days into an actual rand figure, the cash your business is financing itself, plus what a single day faster payment, a single day less stock, or a single day longer to pay suppliers is worth in your own numbers. Most free tools in this space are generic spreadsheet templates with no South African context, no rand figures, and no cost-of-carrying-it comparison against South Africa's own prime lending rate.
Typical debtor, stock and supplier days by business type
Rough starting points only, actual figures vary widely by customer mix and industry. Use your own debtors book and stock records once you have them, they will always beat an industry rule of thumb.
| Business type | Debtor days (DSO) | Stock days (DIO) | Supplier days (DPO) |
|---|---|---|---|
| Retail (fast-moving goods) | 30–45 days | 20–40 days | 30–45 days |
| Wholesale & distribution | 45–60 days | 45–75 days | 30–60 days |
| Manufacturing | 45–60 days | 60–90 days | 45–60 days |
| Professional & consulting services | 30–60 days | 0 days | 15–30 days |
| Construction & contracting | 60–90+ days | 30–60 days | 30–45 days |
A worked example
A wholesale business turning over R6 million a year, on a 35% gross margin, whose customers take 45 days to pay, who holds 40 days of stock, and pays its own suppliers in 30 days, has roughly R847,000 in cash tied up at any one time, before a single rand of profit is actually in the bank. Cutting debtor days by just 10 days would free up about R164,000. Growing that same business's turnover by 15% next year, at the same cycle, needs a further R127,000 tied up in debtors and stock, net of extra supplier credit, on top of what's already locked up, cash that has to come from somewhere before the growth pays for itself. Try your own numbers in the calculator above.
For the wider picture, why this happens, how bad South Africa's late-payment problem really is, and the "growing broke" trap in plain terms, read Why Profitable Businesses Run Out of Cash in South Africa.
Frequently asked questions
What is a cash gap and why does it matter for a South African small business?
The cash gap, also called the cash conversion cycle in rand terms, is the money your business has tied up in unpaid customer invoices and stock, less what you haven't yet paid your own suppliers for. It is real cash that has left your bank account, or that you're still waiting to receive, before a sale actually turns into money you can spend. Cash flow, not profit, is the most commonly cited reason small businesses in South Africa run into trouble, and the cash gap is the single number that explains why a profitable business can still be unable to pay its own bills on time.
Why isn't the cash gap in rand just my turnover times the cash conversion cycle in days, divided by 365?
Because debtor days and stock or supplier days are priced on different bases. What customers owe you sits at the full sale price, but stock you're holding and what you owe suppliers sit at cost, since that's what actually left or is still owed from your bank account. Blending all three components into one daily turnover figure overstates the stock and supplier side whenever your margin is below 100%, which it always is. This calculator prices each component on its correct base, debtors on turnover, stock and payables on cost of sales, and adds them up, rather than multiplying one blended day-rate by turnover.
How much cash does one extra day of customers paying late actually cost me?
Exactly your daily turnover, turnover divided by 365. If your customers take even 5 days longer to pay on average, on R6 million annual turnover that's roughly R82,000 more cash permanently tied up in debtors, money that would otherwise be sitting in your bank account or paying down a facility. The calculator shows this per-day value for debtor days, stock days and supplier days so you can see exactly where a negotiation or a stock-control fix actually pays off in rand, not just days.
Why can a profitable, growing business still run out of cash?
Because growth at the same debtor, stock and supplier days needs proportionally more cash tied up in the business before the extra profit ever reaches your bank account. A business growing turnover 20% a year with a 60-day cash conversion cycle needs roughly 20% more cash locked up in debtors and stock, net of extra supplier credit, just to stand still operationally, on top of what was already tied up. If that extra cash isn't funded from retained profit, an owner top-up or a facility, the growth itself becomes the thing that breaks the business, a well-documented trap often called growing broke.
How big is South Africa's cash flow problem, really?
Bigger than most owners realise, and getting worse. National Treasury's own figures show government invoices unpaid beyond 30 days reached R15.5 billion (90,856 invoices) by the third quarter of the 2025/26 financial year, up from R12.4 billion the previous quarter, with provincial departments responsible for 98% of both the invoice count and the rand value. That's only the government side, private-sector payment cycles of 90 to 120 days are commonly cited as standard in South African supplier relationships, and the full order-to-cash cycle for an SME supplying a large corporate can run well past 150 days once delivery, invoicing and payment terms are all added together. Cash flow, not profit, is consistently cited as the leading reason small businesses in South Africa fail, this calculator exists to put a rand figure on your own version of that problem rather than leave it as a statistic.
What's a realistic number of debtor days if I sell mainly to large corporates or government?
Often much longer than the invoice terms state. Government departments, provincial ones especially, are a documented source of 30-day-plus payment delays (see above), and large corporates commonly run 60 to 90-day cycles even where the invoice says less. If most of your book is large corporate or government clients, use your own actual average payment history rather than your invoice terms, the gap between the two is often where a cash-flow surprise comes from.
What are typical debtor, stock and supplier days by business type?
There's no single right answer, it depends heavily on your industry and customer mix, but rough starting points are useful if you don't yet know your own numbers. See the benchmark table below, then refine using your own actual figures once you have them, your own debtors book and stock records will always beat an industry rule of thumb.
What financing options exist in South Africa to cover a working capital gap, and what do they cost?
The main options are a bank overdraft, invoice discounting or factoring against your debtors book, purchase order or bridging finance, and simply negotiating better terms with your own suppliers. Overdrafts are typically priced as a margin over the South African Reserve Bank's prime lending rate, with the exact margin set by your credit profile. Invoice discounting and factoring are priced per facility based on your specific receivables book, customer concentration and payment history, funders in this market deliberately don't publish a standard rate because pricing genuinely varies that much deal to deal. This calculator's facility-cost figure uses only the published prime rate plus a margin you choose, as an illustrative benchmark, not a quote, get an actual facility proposal on your own numbers before treating any number here as real pricing.
Does VAT change this calculation?
Yes, and it's deliberately not included in the headline figure. If you're a VAT vendor accounting on the invoice basis, you owe SARS output VAT on a sale as soon as you invoice it, regardless of whether your customer has actually paid you yet. A long debtor book therefore effectively finances SARS as well as your own operations, on top of the cash gap shown here. Vendors on the payments basis only account for VAT once it is actually paid or received, which removes this particular drag, but the payments basis is far more restricted than most people realise: SARS limits it to natural persons, meaning sole proprietors and partnerships made up only of natural persons, with taxable supplies under R2.5 million. Companies, close corporations and trusts do not qualify at any turnover, so if you trade through a Pty Ltd the invoice basis is your only option. Our Should I Register for VAT? calculator puts a rand figure on this timing drag and on the VAT decision generally.
What if my business has no stock, like a consulting or professional services firm?
Set stock days to 0. The model still works, it just collapses down to almost entirely the debtor days component, since there's little or no stock and often few formal supplier accounts to offset it. That's expected, not a limitation of the tool, a labour-only service business's cash gap really is mostly about how fast (or slowly) clients pay.
Is this financial advice?
No, it's a free planning tool using simplified assumptions, a single blended set of debtor, stock and supplier days rather than your real, itemised debtors and creditors ledgers, no seasonality, and an illustrative rather than quoted financing cost. It's general information, not financial, accounting or lending advice. For an actual facility, a lender will want your real balance-sheet figures, not estimated days, and for VAT-basis or tax questions, confirm with SARS or a registered accountant.
This calculator gives estimates using simplified, single blended debtor, stock and supplier day assumptions and South Africa's published prime lending rate. It is general information, not financial, accounting or lending advice, and doesn't model VAT timing, seasonality or your actual balance-sheet figures. Confirm your own position with a registered accountant or your bank's business banker. Last reviewed July 2026.