South Africa's Liquidation Numbers for 2026: What the Data Actually Shows
Stats SA quietly revised its liquidation numbers up almost 90%, and its insolvency series just returned after 5 years dark. What 2026 actually shows.

South Africa's liquidation numbers have never stopped being published, but a quiet correction earlier this year revealed they'd been substantially undercounted, and the direction they seemed to show was backwards. Stats SA's own figures now show 2,904 businesses were liquidated in 2025, not the 1,534 the agency itself originally reported, and the first quarter of 2026 alone was revised from 377 recorded closures to 658. A few weeks later, a separate story broke in the same corner of the data, Stats SA's companion count of individual insolvencies had gone dark entirely for five years and only resumed in July 2026. None of that means the sky is falling this year specifically. June 2026's actual liquidation count, 245 businesses, is almost identical to June 2025's. But it does mean a lot of the commentary on South African business failure over the past few years was working from numbers Stats SA has since admitted were wrong, and it's worth going through what the figures, properly read, actually say.
What South Africa's 2026 liquidation numbers actually show
Stats SA's Statistics of Liquidations release for June 2026 puts the month's total at 245 businesses wound up, down 0.4% from 246 a year earlier, essentially flat. The second quarter of 2026 came in at 703 liquidations, 1.4% below the same quarter in 2025, and the first six months of the year totalled 1,361, a 0.9% decline on the 1,373 recorded over the same period last year. Read on their own, those are unremarkable numbers, a business environment holding roughly steady rather than one falling apart. The more useful comparison isn't to last year's equivalent month, though, it's to the base those percentages are being calculated against, because that base has just been revised up substantially.
Why the story looks different from what you may have read before
For years, anyone tracking South African business failures was working from data that undercounted the problem, sometimes by a wide margin. Stats SA's own account, reported by BusinessTech, is that a review with the Companies and Intellectual Property Commission turned up duplicate entries and data extraction problems in the aggregated figures the agency had been submitting, which led to records being both omitted and double counted in the official releases. The scale of the correction is easy to check against Stats SA's own numbers. Its February 2026 release, published before the fix, put annual liquidations for 2020 through 2025 at 2,035, 1,932, 1,907, 1,657, 1,551 and 1,534. Its June 2026 release, published after the fix, gives 2,147, 2,232, 2,311, 2,501, 2,626 and 2,904 for the same six years, an increase of close to 90% in 2025's case alone. Instead of a business failure rate drifting gently downward since 2020, as the old numbers implied, the corrected series shows one climbing every single year.
A separate but related gap closed at almost the same time. Stats SA's companion release on individual and partnership insolvencies had gone dark entirely since September 2021, after a cyberattack on the Department of Justice and Constitutional Development knocked out the department's ability to supply the underlying records. The agency's first standalone insolvency release under the revived series landed on 21 July 2026, covering June 2026 with a rebuilt time series back to January 2023, and it comes with its own caveat: Stats SA has been explicit that the new series isn't a continuation of the old one, because of a break in the data between September 2021 and December 2022. These are two separate problems in two different administrative data pipelines, not one. Liquidations never stopped being published, they were just quietly wrong until the CIPC review surfaced around May 2026. Insolvencies stopped being published altogether for five years and only came back roughly two months later, in July. It's a reminder that a lot of the economic commentary written across that period was necessarily working with a data landscape that had at least one, and for a long stretch two, significant blind spots in it.
Voluntary versus compulsory: what the mix actually shows
Total liquidation counts blend two very different events. A voluntary liquidation is a company's own decision to wind up, which can reflect anything from genuine financial distress to an owner simply retiring or restructuring. A compulsory liquidation is different, it's ordered by a court, usually at a creditor's request, and in principle it's a cleaner signal of businesses that ran out of road rather than chose to stop. In practice, the mix hasn't shifted toward that cleaner distress signal. Compulsory liquidations rose from 230 in 2020 to 291 in 2025, up 26.5%, but voluntary liquidations grew faster over the same years, from 1,917 to 2,613, up 36.3%, so compulsory cases are actually a slightly smaller share of the total now, 10.0% in 2025 against 10.7% in 2020. The first half of 2026 tells the same flat story once you add up the full six months rather than one: 132 compulsory liquidations against 128 over the same period in 2025, up just 3.1%. Whatever's behind the higher revised totals, it isn't creditors and courts forcing more closures than owners are choosing on their own, both categories are simply larger across the board than anyone realised before the revision.
Which industries are actually going under
Here the data comes with a genuine limitation worth stating plainly rather than glossing over. Of the 1,361 liquidations Stats SA recorded in the first half of 2026, 906 of them, two thirds of the total, are filed under "unclassified" rather than a named industry. Of the roughly one third that Stats SA does classify, finance, insurance, real estate and business services accounted for 185 cases and trade, catering and accommodation for 154, making them the two largest identifiable categories by a clear margin, well ahead of community and social services on 44 and construction on 34. Both are sectors with a lot of small, thinly capitalised firms competing on price, which tends to make them the first to show stress when credit tightens or a big customer stops paying on time. It's a real pattern, but it describes roughly a third of the total picture, not all of it, and any claim that leans harder on the sector breakdown than that is reading more into the data than Stats SA itself currently classifies.
The other half of the picture: individual insolvencies, and one month that needs a caveat
Set against rising business liquidations, the newly revived insolvency numbers, covering individuals and partnerships placed under final sequestration, look at first glance like the opposite story. Over the full rebuilt series, 2025 came in lower than 2024, 1,606 insolvencies against 2,105, with 2023 sitting in between at 1,883, though 2025's own total carries a similarly odd month of its own, November 2025 fell to just 81 cases, a 69.3% year-on-year drop that looks like the same kind of incomplete-reporting blip now showing up in June 2026. The widely quoted 2026 comparisons need the same caveat before they're taken at face value, because June, the very first month released under a series that had sat dark for five years, is doing almost all the work. Add up January through May 2026 and the total is 692 cases against 708 over the same five months in 2025, a decline of just 2.3%, essentially flat. June then adds a sharp drop on its own, 61 insolvencies against 139 a year earlier, and that single month is what turns a roughly flat first five months into an 11.1% first-half decline and the headline year-on-year falls of 56.1% for the month and 27.3% for the quarter. Gauteng, which accounts for the large majority of the national count, drives most of that swing by itself, falling from 109 cases in June 2025 to 22 in June 2026. A solitary preliminary month from a data pipeline that only just came back online after a five-year gap is a thin basis for concluding personal insolvencies have suddenly eased, it's worth watching whether the next release confirms it rather than treating June as settled. What the fuller multi-year numbers do support is that individual insolvencies were already easing before 2026, even as business liquidations were being revised sharply upward, two series measuring different kinds of financial failure that have no reason to move together.
What's driving it, and where it's headed
None of the releases explain the numbers, Stats SA reports counts, not causes, so the context has to come from elsewhere. The South African Reserve Bank left interest rates unchanged at its most recent meeting, sparing households a further increase in borrowing costs, but inflation still accelerated to 5% in June, driven largely by transport costs, on top of an extended run of rising food, fuel and electricity prices. Debt counselling firm DebtBusters has reported that the cost of living has overtaken interest rates as consumers' single biggest financial worry, and credit bureau TransUnion has found the same pressure pushing households toward more cautious borrowing and spending. On the corporate side, credit insurer Coface points to the same underlying mix, high borrowing costs, weak demand, infrastructure constraints and logistics problems, squeezing margins hardest at small and medium businesses in fragmented sectors, and flags unpaid invoices specifically, where one large customer defaulting can push an otherwise sound business over the edge. Global trade credit insurer Allianz Trade tracks the same trend using its own business failure index, built on its own definition and data source that produces a much lower count than Stats SA's, 1,540 expected cases in 2026 against Stats SA's thousands, so the two aren't comparable in scale and shouldn't be read side by side as if they were. What Allianz Trade's own figures do show is a change in direction: business failures on its count fell just 1% last year, compared with 6% in 2024 and 13% in 2023, and the firm now expects a slight rise to 1,540 cases in 2026 and 1,590 in 2027. The count itself isn't the useful part here, but an independent index built on a completely different data source pointing the same way Stats SA's revised figures do is worth noting, years of falling business failure look to be levelling off rather than continuing to improve.
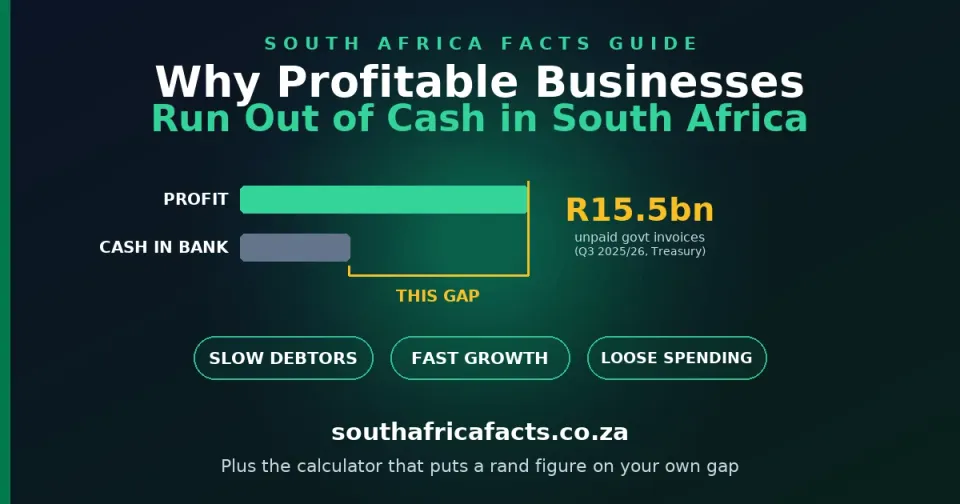
If your own business is feeling any of this squeeze, the practical starting point is usually cash flow rather than the headline numbers. Our Working Capital & Cash Gap Calculator turns your own debtor, stock and supplier days into the actual rand figure tied up in your business right now, and our guide on why profitable businesses run out of cash in South Africa walks through exactly the late-payment and growth-trap dynamics behind a lot of the liquidations above. Keeping SARS and CIPC deadlines off your plate matters too, our Business Compliance Calendar tracks them so a missed filing never becomes the reason a court order lands on your desk.
Frequently asked questions
How many businesses were liquidated in South Africa in 2026?
1,361 businesses were liquidated in the first half of 2026 (January to June), according to Stats SA's Statistics of Liquidations release, down 0.9% on the 1,373 recorded over the same period in 2025. June 2026 alone recorded 245 liquidations, almost unchanged from June 2025's 246.
Why did South Africa's liquidation numbers change so much?
Stats SA revised its historical liquidation data after a review with the Companies and Intellectual Property Commission uncovered duplicate entries and data extraction problems in previously submitted figures. The correction pushed 2025's annual total up from 1,534 to 2,904, and the first quarter of 2026 from 377 to 658, meaning the true scale of business closures had been understated for years.
What's the difference between a liquidation and an insolvency in South Africa?
Liquidation applies to a company or close corporation being wound up, either by its own choice (voluntary) or by court order (compulsory), when its liabilities exceed its assets. Insolvency, in Stats SA's usage, refers specifically to individuals or partnerships placed under final sequestration by a court because they can't pay their debts. They're tracked in separate statistical releases.
Are compulsory liquidations rising in South Africa?
In absolute terms, yes, from 230 in 2020 to 291 in 2025 on Stats SA's revised figures, and 132 in the first half of 2026 against 128 over the same period in 2025. But voluntary liquidations grew faster over the same years, from 1,917 to 2,613, so compulsory cases are actually a slightly smaller share of the total now than in 2020. The mix hasn't shifted toward court-ordered closures, both categories have simply grown.
Why are individual insolvencies falling while business liquidations rise?
They're separate data series measuring different things. Individual and partnership insolvencies did decline over the full 2023 to 2025 period, from 1,883 to 1,606 annually, while business liquidations were revised sharply upward over the same years. But the sharpest 2026 insolvency declines, 56.1% in June and 11.1% for the first half, come almost entirely from one preliminary month in a series that had just resumed after a five-year gap. January to May 2026 alone was down only 2.3% on the same period in 2025, essentially flat, so June's drop is worth confirming in future releases rather than treating as an established trend.
Which industries have the most liquidations in South Africa?
Among the roughly one third of liquidations Stats SA actually classifies by industry, finance, insurance, real estate and business services, and trade, catering and accommodation are the two largest categories. Two thirds of all liquidations in the first half of 2026 were recorded as "unclassified," so any industry-level claim, including this one, should be read as describing part of the picture rather than all of it.
For more on managing the cash flow pressure behind a lot of these numbers, see our Working Capital & Cash Gap Calculator and Why Profitable Businesses Run Out of Cash guide, or find our full set of free business tools on the tools and calculators page.
This article is general information on South Africa's published liquidation and insolvency statistics, not financial, legal or investment advice. Figures are drawn from Stats SA's Statistics of Liquidations (P0043.1) releases for February and June 2026, its Statistics of Insolvencies (P0043.2) release for June 2026, and from BusinessTech, IOL, Coface and Allianz Trade reporting on the underlying data, current as of July 2026. Last reviewed July 2026.
What do you think?
Join the conversation on our South African community forum. Share your perspective, ask a question, or just say hello.