South Africa's 12 Official Languages: What Census 2022 Shows
Twelve official languages, and a census that measures only one of the places you use them. What the numbers show once you read past the list.
South Africa has twelve official languages. South African Sign Language became the twelfth in July 2023, joining the eleven written into the Constitution in 1996. That much is on every fact page about the country, including our own.
What the census measures is narrower, and more interesting. Statistics South Africa asks which language is spoken most often in the household, so what comes back is a map of home languages, not of the language you use at work, at school or on the taxi rank. Read with that limit in mind, the Census 2022 numbers say something the list of twelve cannot: the country's languages are heavily concentrated by province, they are mixing faster than they used to, and the one that runs the schools and the universities is spoken at home by fewer than one South African in ten.
All twelve official languages
South Africa's official languages, in alphabetical order, are Afrikaans, English, isiNdebele, isiXhosa, isiZulu, Sepedi (Northern Sotho), Sesotho, Setswana, siSwati, South African Sign Language, Tshivenda and Xitsonga. Eleven were named in the 1996 Constitution and South African Sign Language was added in July 2023.
The most spoken languages in South Africa, in order
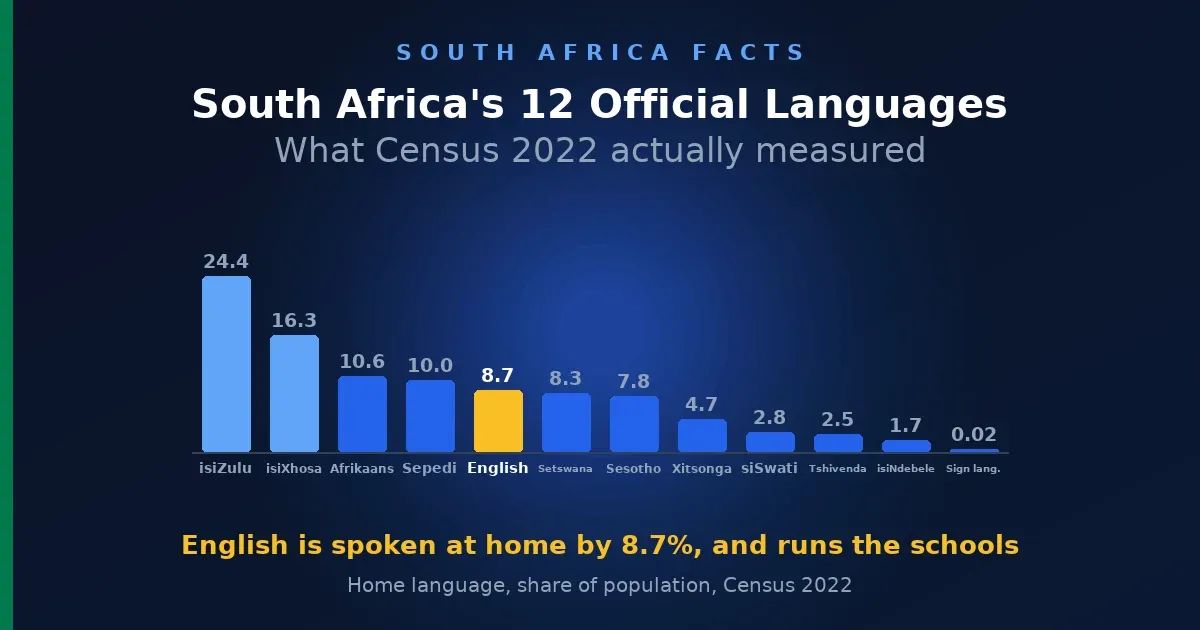
IsiZulu has been the largest home language at every census since 1996 and its share has grown. English has barely moved in nearly three decades.
| Language | 1996 | 2001 | 2011 | 2022 |
|---|---|---|---|---|
| isiZulu | 22.8% | 23.8% | 22.7% | 24.4% |
| isiXhosa | 17.9% | 17.6% | 16.0% | 16.3% |
| Afrikaans | 14.5% | 13.4% | 13.5% | 10.6% |
| Sepedi | 9.2% | 9.4% | 9.0% | 10.0% |
| English | 8.7% | 8.3% | 9.7% | 8.7% |
| Setswana | 8.2% | 8.2% | 8.0% | 8.3% |
| Sesotho | 7.7% | 7.9% | 7.6% | 7.8% |
| Xitsonga | 4.4% | 4.4% | 4.5% | 4.7% |
| siSwati | 2.5% | 2.7% | 2.5% | 2.8% |
| Tshivenda | 2.2% | 2.3% | 2.4% | 2.5% |
| isiNdebele | 1.5% | 1.6% | 2.1% | 1.7% |
| Other | 0.6% | 0.5% | 1.6% | 2.1% |
Share of the population by language most often spoken in the household. Sign language was charted separately and is discussed below. Source: Stats SA, Cultural Dynamics in South Africa (Report 03-01-84), Census 2022, Figure 2.1.
The Afrikaans line is the one worth pausing on, because it is easy to read wrong. Its share fell from 14.5% in 1996 to 10.6% in 2022, and most of that drop came between the last two censuses. But the number of Afrikaans speakers rose by more than 700 000 over the same period. The share fell because the rest of the population grew faster, which is a different story from a language losing speakers.
Eight provinces have a dominant language, and then there is Gauteng
Apartheid's homeland boundaries were drawn along state-designated ethnic lines, and the census still shows their outline. Eight of the nine provinces have a single home language above 30%. Four of them are above 70%.
| Province | Largest home language | Share |
|---|---|---|
| Eastern Cape | isiXhosa | 81.8% |
| KwaZulu-Natal | isiZulu | 80.0% |
| North West | Setswana | 72.8% |
| Free State | Sesotho | 72.2% |
| Limpopo | Sepedi | 55.6% |
| Northern Cape | Afrikaans | 54.6% |
| Western Cape | Afrikaans | 41.1% |
| Mpumalanga | siSwati | 30.6% |
| Gauteng | isiZulu | 23.2% |
Source: Stats SA, Cultural Dynamics in South Africa (Report 03-01-84), Census 2022, Table 2.1.
Gauteng is the exception. No language reaches a quarter of the province. IsiZulu leads on 23.2%, then Sesotho on 13.1%, Sepedi on 12.7% and Setswana on 10.3%. It is the smallest province by area, the largest by population, and the one place in the country where no single language can be assumed.
South Africa language map by province
Largest home language in each province, Census 2022. Colours repeat where two provinces share a language, so Gauteng and KwaZulu-Natal are both isiZulu and the Northern and Western Cape are both Afrikaans. Source: Stats SA, Cultural Dynamics in South Africa (Report 03-01-84), Census 2022, Table 2.1.
The metros do not look like their provinces
Provincial averages hide what happens in the cities, which is where most internal migration lands. Cape Town is the clearest case: Afrikaans is the largest home language in the Western Cape on 41.1%, but inside the metro it drops to 26.1% and isiXhosa is the largest on 37.4%.
| Metro | Largest home language | In the metro | Same language, province |
|---|---|---|---|
| Buffalo City | isiXhosa | 82.4% | 81.8% |
| Nelson Mandela Bay | isiXhosa | 59.5% | 81.8% |
| eThekwini | isiZulu | 65.6% | 80.0% |
| Mangaung | Sesotho | 64.0% | 72.2% |
| City of Ekurhuleni | isiZulu | 35.7% | 23.2% |
| City of Johannesburg | isiZulu | 28.9% | 23.2% |
| City of Cape Town | isiXhosa | 37.4% | 31.4% |
| City of Tshwane | Sepedi | 24.4% | 12.7% |
The last column is that same language's share across the whole province, for comparison. Source: Stats SA, Cultural Dynamics in South Africa (Report 03-01-84), Census 2022, Tables 2.1 and 2.3.
Multilingual households have nearly tripled
Stats SA counts a household as multilingual when the people living in it give different main languages. On that definition 3.5% of South African households were multilingual in 1996. By 2022 it was 9.4%.
| Province | 1996 | 2022 |
|---|---|---|
| Gauteng | 7.0% | 17.0% |
| Western Cape | 3.9% | 10.5% |
| Mpumalanga | 3.4% | 7.7% |
| North West | 3.3% | 7.0% |
| Northern Cape | 3.0% | 5.9% |
| Free State | 3.1% | 5.8% |
| Eastern Cape | 1.4% | 5.6% |
| KwaZulu-Natal | 2.2% | 5.4% |
| Limpopo | 1.9% | 4.8% |
| South Africa | 3.5% | 9.4% |
Percentage of households where members give different main languages. Source: Stats SA, Cultural Dynamics in South Africa (Report 03-01-84), Census 2022, Figure 2.3.
Every province rose, but Gauteng and the Western Cape rose furthest, which fits their position as the two provinces that receive the most migrants both from elsewhere in South Africa and from outside it. Eastern Cape and Limpopo, the two provinces people tend to leave, stayed lowest.
More than a million people speak no official language at home
Census 2022 expanded the list respondents could choose from, and 1 252 633 people gave a language that is not one of the twelve.
| Language | Speakers |
|---|---|
| Shona | 721 124 |
| Other | 267 725 |
| Chichewa, Chewa, Nyanja or Chinyanja | 162 047 |
| Portuguese | 95 613 |
| Khoi, Nama and San languages | 6 124 |
| Total | 1 252 633 |
Source: Stats SA, Cultural Dynamics in South Africa (Report 03-01-84), Census 2022, Figure 2.2 and Table 2.4.
Shona alone accounts for more than half. Gauteng is home to 43.1% of everyone in this table, and the provincial pattern tracks both work and borders: Limpopo has the second largest Shona-speaking population and shares a border with Zimbabwe, while Mpumalanga has the second largest Portuguese-speaking one and shares a border with Mozambique.
The smallest line in that table carries the most history. Just 6 124 people gave a Khoi, Nama or San language, about 40% of them in the Northern Cape. Stats SA flags this figure itself, noting that sparse and isolated settlement makes indigenous populations hard to enumerate, so the true number is likely higher than the count.
Where language turns into advantage
This is the part of the census that stops being a description of diversity and starts being a measure of inequality. Stats SA tracked two progression ratios by home language: the proportion of people who finish Grade 12 after finishing Grade 9, and the proportion who finish a bachelor's degree after finishing Grade 12.
| Home language | Grade 9 to matric | Matric to degree |
|---|---|---|
| English | 0.86 | 0.29 |
| siSwati | 0.74 | 0.05 |
| Tshivenda | 0.72 | 0.12 |
| isiZulu | 0.71 | 0.06 |
| Setswana | 0.71 | 0.07 |
| Sepedi | 0.70 | 0.07 |
| Afrikaans | 0.68 | 0.21 |
| Xitsonga | 0.68 | 0.07 |
| Sesotho | 0.68 | 0.06 |
| isiNdebele | 0.63 | 0.05 |
| isiXhosa | 0.61 | 0.08 |
Proportions, 2022. Source: Stats SA, Cultural Dynamics in South Africa (Report 03-01-84), Census 2022, Figures 2.4 and 2.5.
English speakers finish school at a higher rate than every other group, and the gap at school level is real but not enormous. IsiXhosa speakers, lowest on the table, have closed a lot of ground over sixty years, rising from 0.42 in 1960 to 0.61 in 2022.
The degree column is where the picture changes. English sits at 0.29 and Afrikaans at 0.21. The next language down is Tshivenda at 0.12, and most of the rest cluster between 0.05 and 0.08. An English-speaking matriculant is roughly five times as likely to finish a degree as an isiZulu-speaking one.
The siSwati line shows it clearly. SiSwati speakers have the second highest school completion ratio in the country at 0.74, ahead of Afrikaans. At degree level they sit at 0.05, near the bottom. Whatever is happening between matric and graduation is not explained by how well people finish school.
Stats SA's own reading is that English is the medium of instruction in the South African schooling system and in most universities, with some using Afrikaans as well, and that this hands an advantage to people who already speak those languages at home. That is the gap the list of twelve official languages does not show you: the two languages spoken at home by 19.3% of the population between them are the two languages the education system runs in.
What the census does not tell you
Three limits are worth stating plainly, because they are easy to talk past.
It measures the home, and only the home. Stats SA says so directly in the report, noting that people generally speak other languages at work and elsewhere. There is no census series for what South Africans speak on the job, in a shop or in a classroom, so nobody can tell you from this data how many people use isiZulu or Afrikaans in a day. The multilingual-household numbers are the closest proxy available, and they only count what happens inside one house.
The sign language figure is not a trend. Figure 2.1 shows 0.46% in 2011 and 0.02% in 2022, which looks like a collapse and is not one. The two censuses collected the question differently. Nothing in this data speaks to how many South Africans use South African Sign Language, and it should not be read against SASL becoming official in 2023.
It is 2022 data. The census was taken in February 2022 and the analysis published in 2025. As of 2026 it is still the most recent complete language count the country has, and it will stay that way until the next census. Population totals elsewhere on this site, such as the country overview, use newer mid-year estimates, so the two will not line up and are not meant to.
Common questions
What is the most spoken language in South Africa?
IsiZulu, spoken at home by 24.4% of the population at Census 2022, followed by isiXhosa on 16.3% and Afrikaans on 10.6%. English is fifth on 8.7%. This ranks home language only, which is the only language question the census asks.
How many official languages does South Africa have?
Twelve. The Constitution recognised eleven from 1996, and South African Sign Language was added in July 2023 by the Eighteenth Amendment.
Is English the most widely spoken language in South Africa?
Not as a home language. At 8.7% it is fifth. English is dominant in a different sense, as the main medium of instruction in schools and universities and the common working language in much of business and government, but the census does not measure that use.
Which province has the most languages?
Gauteng is the most linguistically mixed. It is the only province where no language reaches 25%, it has the highest proportion of multilingual households at 17.0%, and it is home to 43.1% of everyone who speaks a non-official language at home.
What is the most spoken language in Cape Town?
IsiXhosa, on 37.4% of the City of Cape Town metro at Census 2022, ahead of English on 30.6% and Afrikaans on 26.1%. The metro does not match its province: across the Western Cape as a whole Afrikaans leads on 41.1%.
What is the most spoken language in Johannesburg?
IsiZulu, on 28.9% of the City of Johannesburg at Census 2022, followed by English on 13.7% and Sesotho on 11.9%. Across Gauteng as a whole isiZulu leads on 23.2%, and no language in the province reaches a quarter.
What is the most spoken language in Durban?
IsiZulu, on 65.6% of the eThekwini metro at Census 2022, with English second on 28.6%. Across KwaZulu-Natal as a whole isiZulu is higher still, on 80.0%.
Which South African languages have click sounds?
The four Nguni languages: isiXhosa, isiZulu, siSwati and isiNdebele. They took their click consonants from Khoisan languages through long contact, and isiXhosa uses them most extensively. The Khoi, Nama and San languages themselves have the densest click systems of any languages in the world, and 6 124 people gave one of them as their home language at Census 2022.
Is Afrikaans dying out?
Not by speaker count. The Afrikaans share of the population fell from 14.5% in 1996 to 10.6% in 2022, but the number of Afrikaans speakers grew by more than 700 000 over the same period. The share fell because the population as a whole grew faster.
Sources
- Statistics South Africa, Cultural Dynamics in South Africa (Report 03-01-84, 2025), Chapter 2. All Census 2022 language figures on this page.
- Parliament of South Africa, NA approves South African Sign Language as the 12th official language (2023).
- Constitution of the Republic of South Africa, Eighteenth Amendment (assented to 19 July 2023).
Related: South Africa at a glance, the Zulu people, and the Semigration Town Finder if you are weighing up a move between provinces.
What do you think?
Join the conversation on our South African community forum. Share your perspective, ask a question, or just say hello.