
Chance of Rain Calculator (South Africa)
Pick a town and a month and see how many days of that month are actually wet, from 47 years of daily rainfall across 29 South African towns. Then check the chance of getting enough dry days in a row to paint, waterproof or pour a slab.
Chance of Rain Calculator, South Africa
Pick your town and the month you are planning for, and see how often it actually rains, based on 47 years of daily rainfall. Then check the odds of getting a run of dry days long enough to paint, waterproof or pour a slab. Every town is checked against a published South African Weather Service or NOAA rainfall normal.
This is not a weather forecast. It is what the last 47 years did at the same time of year, which is a useful baseline for choosing between months when you are booking something far ahead. Check a real forecast in the final week.
My town is not on the list
How often does it actually rain where you live?
Most rainfall pages give you an average, in millimetres, for a month. That is the wrong number for planning. Nobody cancels a wedding because of millimetres. What you want to know is how many days of that month are actually wet, and whether the month you are looking at is meaningfully better than the one before it. This tool answers that for 29 South African towns using 47 years of daily rainfall.
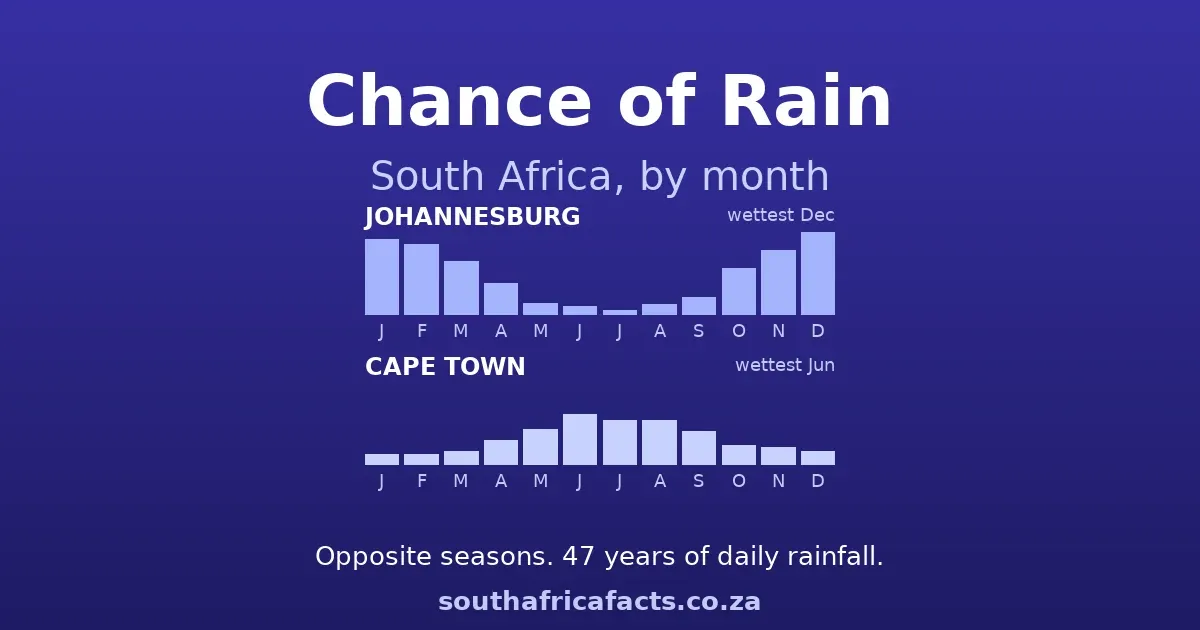
South Africa makes this unusually worth checking, because the country runs on two opposite rainfall calendars. The Highveld, the Lowveld, the Free State and most of KwaZulu-Natal get their rain in summer, so Johannesburg swings from about 2% of days wet in July to about 45% in December. The south western Cape does the reverse, with Cape Town at about 5% in February and about 27% in June. The southern Cape coast does neither and simply drizzles all year, which is why George sits between about 16% and about 23% in every single month of the year.
Planning outdoor work is a different question
Painting, waterproofing, plastering and concrete do not care whether one particular day is wet. They care whether you can get several dry days in a row. That is a different statistic and it is the one nobody publishes for South Africa, so the second tab works it out: pick the job, see the odds of an uninterrupted run by starting month.
It also settles an argument. Search for the best time to paint a house in South Africa and you will find national advice saying winter, and other national advice saying summer. Both are half right. Starting a five day job in Johannesburg in July works out about 93% of the time against about 11% in December, so winter wins on the Highveld. In Cape Town the same job is about 79% in February against about 29% in June, so winter is the worst thing you could pick. Neither piece of advice is wrong, they are just about different halves of the country.
What this tool will not do
It will not tell you which Saturday in November to choose. That was the original plan and testing killed it: splitting the record in half and asking each half which day of a month is driest, the halves agreed 4% of the time, which is chance. Ranking days is reading noise, so this tool ranks months and says so wherever it might be tempting to read more into a chart than the data holds.
When is the rainy season in South Africa?
There is no single answer, because the country runs two opposite calendars and a third region that barely has a season at all. On the Highveld, the Lowveld, the Free State and most of KwaZulu-Natal the rain arrives with the first thunderstorms around October and runs to about March, so Johannesburg goes from roughly 2% of days wet in July to about 45% in December. The south western Cape is the mirror image, wettest in June at about 27% of days and driest in midsummer. The southern Cape coast, from Mossel Bay through George to Plettenberg Bay, gets rain in every month of the year and has no meaningful dry season at all.
For the fuller picture, ocean currents, temperature and frost as well as rainfall, see our South Africa Climate Guide.
Which rainfall region is my town in?
South Africa has three, and which one you are in decides everything about when to plan an outdoor job. The split below is measured rather than drawn by eye: it is the share of a town's annual rainfall that falls in the winter half of the year, April to September. Under 40% is a summer rainfall town, over 60% is a winter rainfall town, and in between is a town with no strongly dry half.
Summer rainfall, 17 of 29 towns
Rain arrives with the thunderstorms around October and runs to about March, and winter is the dry half. This is most of the country: the Highveld, the Lowveld, the Free State, the Karoo interior and almost all of KwaZulu-Natal. Johannesburg runs from about 2% of July days wet to about 45% in December.
Bethlehem, Bloemfontein, De Aar, Durban, East London, Howick, Johannesburg, Kimberley, Mahikeng, Makhanda, Nelspruit, Newcastle, Pietermaritzburg, Polokwane, Pretoria, Rustenburg, Upington.
Rain in every season, 8 of 29 towns
Mostly the southern and eastern Cape coast, where rain is spread through the year and no month is reliably dry. Calvinia in the Karoo lands here too, on the winter edge of the group. George sits between about 16% and 23% of days wet in every month of the year, which is why the tool refuses to name a best month for these towns rather than picking one out of noise.
Calvinia (close to the winter-rainfall group), George, Gqeberha (close to the summer-rainfall group), Knysna, Mossel Bay, Oudtshoorn, Plettenberg Bay, St Francis Bay.
Winter rainfall, 4 of 29 towns
The south western Cape, the mirror image of the rest of the country. Most of the rain falls between about April and September and midsummer is the dry half, so Cape Town is wettest in June at about 27% of days and driest in February at about 5%.
Cape Town, Malmesbury, Paarl, Stellenbosch.
If your own town is not listed, pick the one in your group that is most like yours in landscape, a coastal town for a coastal town and an inland one for an inland one, rather than the closest on a map. Thirty kilometres over a mountain range can be a different rainfall world, which is the same reason the town list is short in the first place. Two towns are marked above as sitting close to a boundary, and for those the honest reading is that they behave a little like both neighbours.
Driest and wettest month for every town
Rain days, not millimetres. A month can carry a big total in two downpours and still be mostly dry, which is why the millimetre figures published elsewhere are a poor guide to whether your day will be rained on. Where several months are too close to separate, this table says so instead of picking one. There is one table per rainfall region, so the towns listed alongside yours are the ones whose weather actually resembles it.
Summer rainfall towns, 17 of 29
Rain roughly October to March, dry winters.
| Town | Province | Driest month | Wettest month | Rain days a year | Best month to start a 5 day job |
|---|---|---|---|---|---|
| East London | Eastern Cape | May and 3 others | Jan and 5 others | 76 | May, Jun and Jul |
| Makhanda | Eastern Cape | May and 3 others | Feb and 5 others | 68 | May, Jun and Jul |
| Bethlehem | Free State | Jun and Jul | Jan, Feb and Dec | 76 | Jul |
| Bloemfontein | Free State | Jun, Jul and Aug | Jan, Feb and Dec | 58 | Jul |
| Johannesburg | Gauteng | Jul | Jan, Feb and Dec | 77 | Jul |
| Pretoria | Gauteng | Jun, Jul and Aug | Jan and 3 others | 66 | Jul |
| Durban | KwaZulu-Natal | May and 3 others | Jan and 5 others | 88 | May, Jun and Jul |
| Howick | KwaZulu-Natal | May, Jun and Jul | Jan and 3 others | 100 | May, Jun and Jul |
| Newcastle | KwaZulu-Natal | May, Jun and Jul | Jan and Dec | 82 | May and 3 others |
| Pietermaritzburg | KwaZulu-Natal | Jun and Jul | Jan and Dec | 96 | May, Jun and Jul |
| Polokwane | Limpopo | Jun, Jul and Aug | Jan, Nov and Dec | 52 | Jun, Jul and Aug |
| Nelspruit | Mpumalanga | Jun and Jul | Jan and 3 others | 83 | Jun and Jul |
| Mahikeng | North West | Jul and Aug | Jan, Feb and Dec | 59 | Jul |
| Rustenburg | North West | Jul and Aug | Jan, Feb and Dec | 63 | Jul |
| De Aar | Northern Cape | May and 4 others | Jan and 5 others | 36 | May and 4 others |
| Kimberley | Northern Cape | May and 3 others | Jan and 3 others | 48 | Jul |
| Upington | Northern Cape | May and 3 others | Jan and 4 others | 23 | Jun and 3 others |
Towns with rain in every season, 8 of 29
No strongly dry half of the year, the southern and eastern Cape coast.
| Town | Province | Driest month | Wettest month | Rain days a year | Best month to start a 5 day job |
|---|---|---|---|---|---|
| Gqeberha | Eastern Cape | May and 3 others | Feb and 5 others | 61 | Jan and 5 others |
| St Francis Bay | Eastern Cape | no clearly driest month | no clearly wettest month | 69 | much the same all year |
| Calvinia | Northern Cape | no clearly driest month | Jun, Jul and Aug | 25 | Jan and 5 others |
| George | Western Cape | Apr and 5 others | no clearly wettest month | 73 | much the same all year |
| Knysna | Western Cape | no clearly driest month | no clearly wettest month | 77 | much the same all year |
| Mossel Bay | Western Cape | no clearly driest month | no clearly wettest month | 51 | much the same all year |
| Oudtshoorn | Western Cape | no clearly driest month | no clearly wettest month | 43 | much the same all year |
| Plettenberg Bay | Western Cape | no clearly driest month | no clearly wettest month | 73 | much the same all year |
Winter rainfall towns, 4 of 29
Rain roughly April to September, dry summers, the south western Cape.
| Town | Province | Driest month | Wettest month | Rain days a year | Best month to start a 5 day job |
|---|---|---|---|---|---|
| Cape Town | Western Cape | Jan and 3 others | Jun, Jul and Aug | 52 | Jan and 3 others |
| Malmesbury | Western Cape | Jan and 3 others | Jun, Jul and Aug | 49 | Jan and 4 others |
| Paarl | Western Cape | Jan and 3 others | Jun, Jul and Aug | 64 | Jan and 3 others |
| Stellenbosch | Western Cape | Jan, Feb and Mar | Jun, Jul and Aug | 70 | Jan and 3 others |
Rain days a year counts days with at least about a millimetre, the same standard the South African Weather Service uses. The last column is the month to begin a five day outdoor job for the best chance of finishing without a wet day.
Where these numbers come from
Every figure on this page is computed from 47 years of daily rainfall, 1979 to 2025, taken from the ERA5 reanalysis through the Open-Meteo historical archive. Reanalysis is not a set of rain gauge readings. It is a physical model of the atmosphere replayed over the past and constrained by the observations of the day, which is what makes a consistent daily record reaching back to 1979 possible at all, and it is also the source of the limits below.
The model runs on a grid roughly 25 km across, so it reproduces South African annual totals well but spreads them across too many days, reading light drizzle where a gauge would record nothing. Two corrections are applied in that order. First, each town's annual total is scaled onto its own published rainfall normal, from the South African Weather Service or NOAA. Where a town's published normal covered a period too old to compare against a modern model window, it was dropped rather than corrected onto, because the difference between the two periods would have been imported as if it were model bias. Second, a single national threshold of 2.15 mm defines a wet day, which is what reproduces the real number of rain days despite sounding higher than the roughly one millimetre a weather office uses.
Those two steps are checked against different things on purpose. The scaling is fitted on annual millimetres; the result is then validated against published rain-day counts, which were not used to fit it. 12 of the 29 towns have such a count published and come out with a mean error of about 8%. The rest have an annual normal only, and say so on screen. A town with no published normal at all is not listed, because there would be no way to know whether its answer was right.
The grid is also why the town list is short rather than exhaustive. Sampling one metro at two different points inside its own boundary moved its annual total by 47%, so a town without its own published normal to correct against is genuinely unknown rather than probably fine. The underlying record is refreshed once a year, in March, after the archive settles. Adding a year moves the typical answer by about a fifth of a percentage point, well inside the margin of error already shown on every figure.
Common questions
What is the driest month in Johannesburg?
July, by a wide margin. On the 1979 to 2025 record only about 2% of July days in Johannesburg see meaningful rain, against about 45% in December and about 41% in January. Pretoria follows the same pattern, about 2% in July against about 38% in December. The whole Highveld has a genuinely dry winter, which is why it is the safe season for anything outdoors.
When is it driest in Cape Town?
The opposite half of the year to the rest of the country. Cape Town is driest in January and February at about 5% of days, and wettest in June at about 27%. That inversion is real and it catches people out: a June wedding is close to the safest month on the Highveld and close to the riskiest in the Cape. Stellenbosch and Paarl follow Cape Town, not Johannesburg.
Can this tell me if it will rain on my wedding day?
No, and nothing can, more than about ten days ahead. What it can tell you is how often that time of year has actually been wet over 47 years, which is the only useful input when you are booking a venue months in advance. Use it to choose between months, then use a real forecast in the last week.
Why does it only answer by month and not by date?
Because the data cannot support anything finer, and we tested that rather than assuming it. Splitting the record into odd and even years and asking each half which day of a given month is driest, the two halves agreed only 4% of the time, which is what you would get from random noise. Grouping into five-day blocks got it to 21%, still chance. Any tool that tells you the 8th of November is drier than the 22nd is reading noise. Month-to-month differences, by contrast, are enormous and completely solid.
When is the best time to paint or waterproof a house in South Africa?
It depends entirely on which half of the country you are in, which is why the general advice you find online contradicts itself. In Johannesburg, starting a five-day job in July gives you about a 93% chance of an uninterrupted dry run, against about 11% in December. In Cape Town it reverses: about 79% in February against about 29% in June. So winter is right for the Highveld and badly wrong for the Cape.
How do you work out the chance of a run of dry days?
It takes a random starting day in the month you choose and asks how often the next few days were all dry, averaged over every start day and all 47 years. Runs deliberately carry over into the following month, because a job started on the 28th does not stop at month end. That is why the answer is phrased as "if you start in" a month rather than "during" it.
How accurate is this?
Each town's annual rainfall is matched to a published South African Weather Service or NOAA normal. For the 12 towns that also publish a rain-day count, the model is checked against it too, and lands within 7.6% on average. Towns that only publish an annual figure are shown as such on the page. A town with no published normal at all is not listed, because there would be no way to know whether it was right.
Why are so few towns listed?
Because the underlying rainfall model runs on a grid roughly 25 km across, which cannot resolve a mountain on one side and a coastal plain on the other. In one metro that error reached 47% depending on which point in the city was sampled. Every listed town is one where a published rainfall normal exists to correct and check the model against. Adding towns we cannot check would mean adding wrong answers in exactly the places, the Winelands, the Garden Route, the Midlands, where the grid struggles most.
Has South African rainfall changed recently?
On this record, yes, and you can see it with the toggle on the page. Johannesburg December sits at about 45% of days wet over the full 47 years but about 39% over the last 10 years. The Cape shows the opposite in some months. The full record is the better guide for planning, since a single decade is a small sample, but both are shown rather than quietly picking one.
What counts as a rainy day here?
A day with at least about a millimetre of rain, which is the standard the South African Weather Service uses for its published rain-day counts. Light drizzle that barely wets the ground is not counted. The model applies a 2.15 mm cut internally, which sounds odd until you know that reanalysis rainfall smears the right annual total over too many days, so the higher cut is what reproduces the real number of rain days.
Why does Wikipedia show more rain days for my town?
Because it is usually counting a different day. A climate table states its threshold in the heading, and the common one is 0.1 mm or more, which counts any trace of drizzle. This page counts days from about a millimetre, the South African Weather Service standard for a rain day, so it will read lower almost everywhere. Cape Town works out to about 52 rain days a year here, against the mid sixties on a 0.1 mm count. Neither figure is wrong, they answer different questions, and the one that matters for planning is whether enough rain fell to stop you working. Check the threshold in the heading before comparing any two sources.
Does this cover storms, hail or flooding?
No, deliberately. The underlying model under-reads sharp convective downpours, the Highveld afternoon thunderstorm in particular, so it can tell you how often a day is wet but not how hard it rained. Anything phrased as a one in twenty year storm, a flood risk or a stormwater sizing is outside what this data can honestly support.
When does the rainy season start in Johannesburg and Pretoria?
The wet-day chance climbs steeply through October. In Johannesburg it goes from about 9% of days wet in September to about 25% in October and about 35% in November, so October is the month the season actually turns. Pretoria follows within a week or so. The back end is sharper than the front: April is still about 17%, but May drops to about 6%.
What is the wettest month in South Africa?
It depends which South Africa you mean, and that is the whole point. On the Highveld it is December, at about 45% of days wet in Johannesburg. In Cape Town it is June, at about 27%. In Durban the year is much flatter, peaking around November at about 34%. Anyone quoting one wettest month for the whole country is averaging two opposite climates together.
Which towns are covered?
29 towns across all nine provinces, chosen by whether a published rainfall normal exists rather than by size. That includes the big metros, the Winelands, the Garden Route, the KwaZulu-Natal Midlands, the Karoo and the Northern Cape. They fall into three rainfall regions: 17 summer rainfall towns, 8 with rain in every season and 4 winter rainfall towns, listed by name under the rainfall region heading above.
My town is not on the list. Which one should I use instead?
Pick the listed town in the same rainfall region as yours, and within that region the one most like yours in landscape, a coastal town for a coastal town and an inland one for an inland one. Do not simply take the nearest name on the map. Stellenbosch and Cape Town are neighbours in the same rainfall region and Stellenbosch still averages about 878 mm a year against Cape Town's 492 mm, because the mountains behind it wring out far more rain. Landscape moves the answer as much as distance does. The three regions are listed town by town above, and the tool itself carries the same list under "My town is not on the list".
Related tools
Questions, corrections or a town you would like added? Discuss this tool on the forum.